WHY ITT?
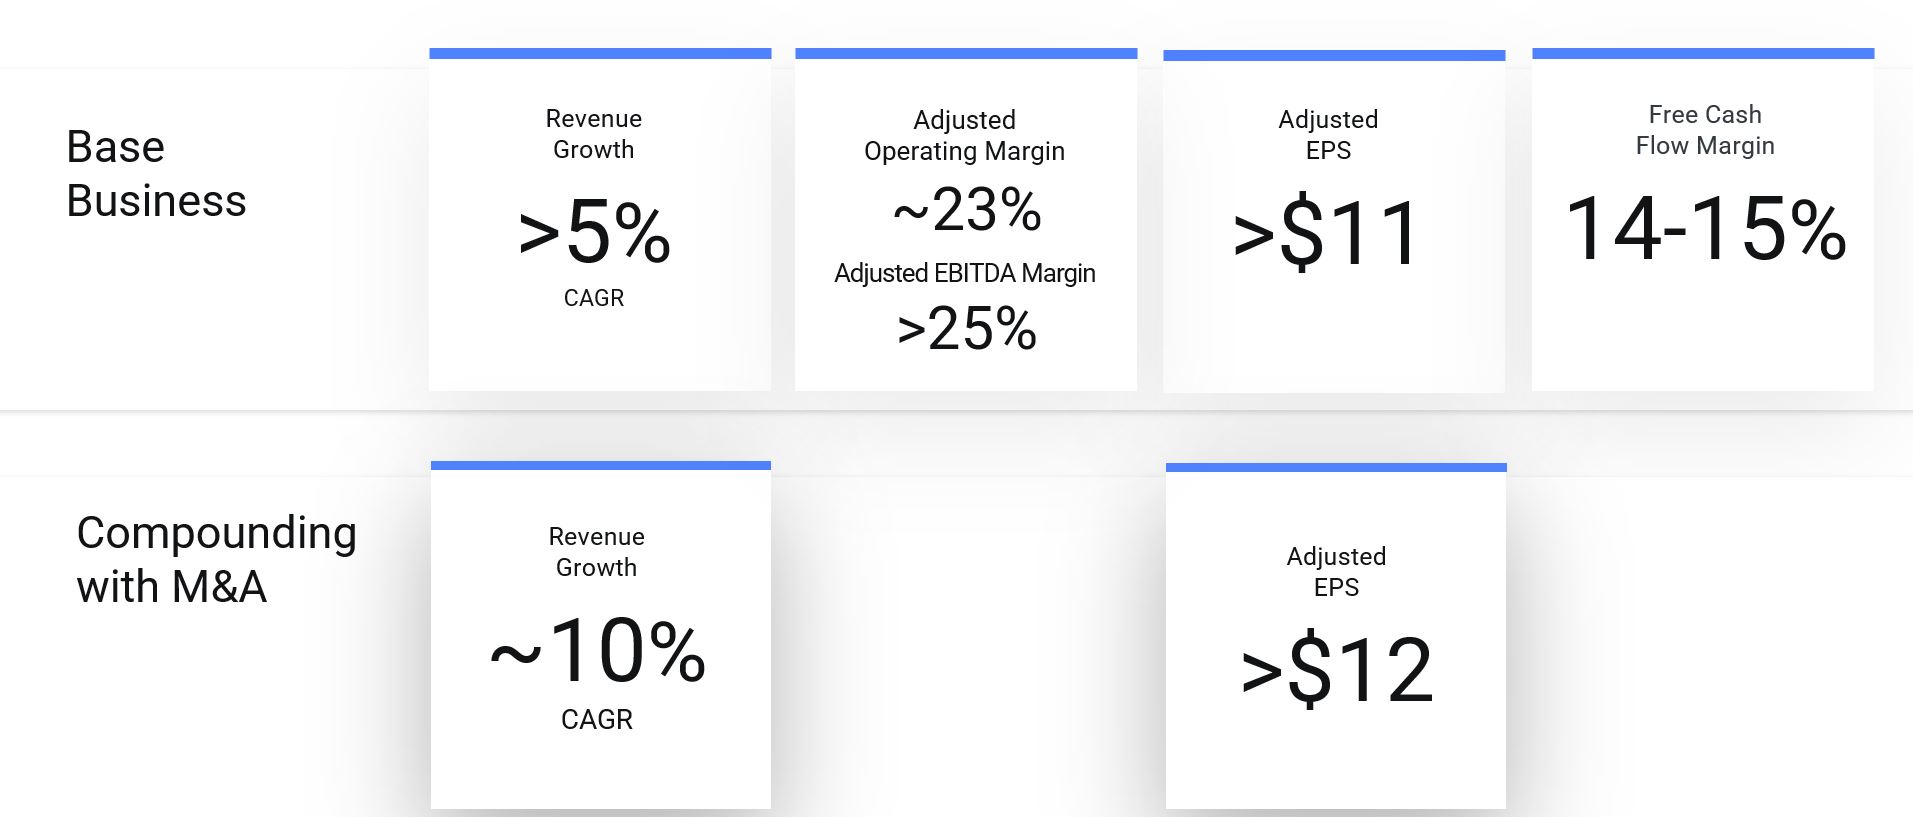
ITT is a leading manufacturer of critical components for harsh environments that serves fast-growing end markets in flow, aerospace and defense, energy and transportation. You can read more about these end markets here. Our differentiation – which has powered a total shareholder return of 45% from 2021-2024 – is driven by our execution, innovation and now, M&A. A combination of organic growth and margin expansion, along with an anticipated $500 to $700 million per year towards highly strategic acquisitions, are expected to drive the next chapter of value creation at ITT. In May 2025, we held our latest Capital Markets Day and announced new 2030 long-term financial targets. You can view the presentation from the event here.
Some of the information included herein includes forward-looking statements. For more information, please click here.
2030 Long-Term Financial Targets (Announced at 2025 Capital Markets Day)
Press Releases
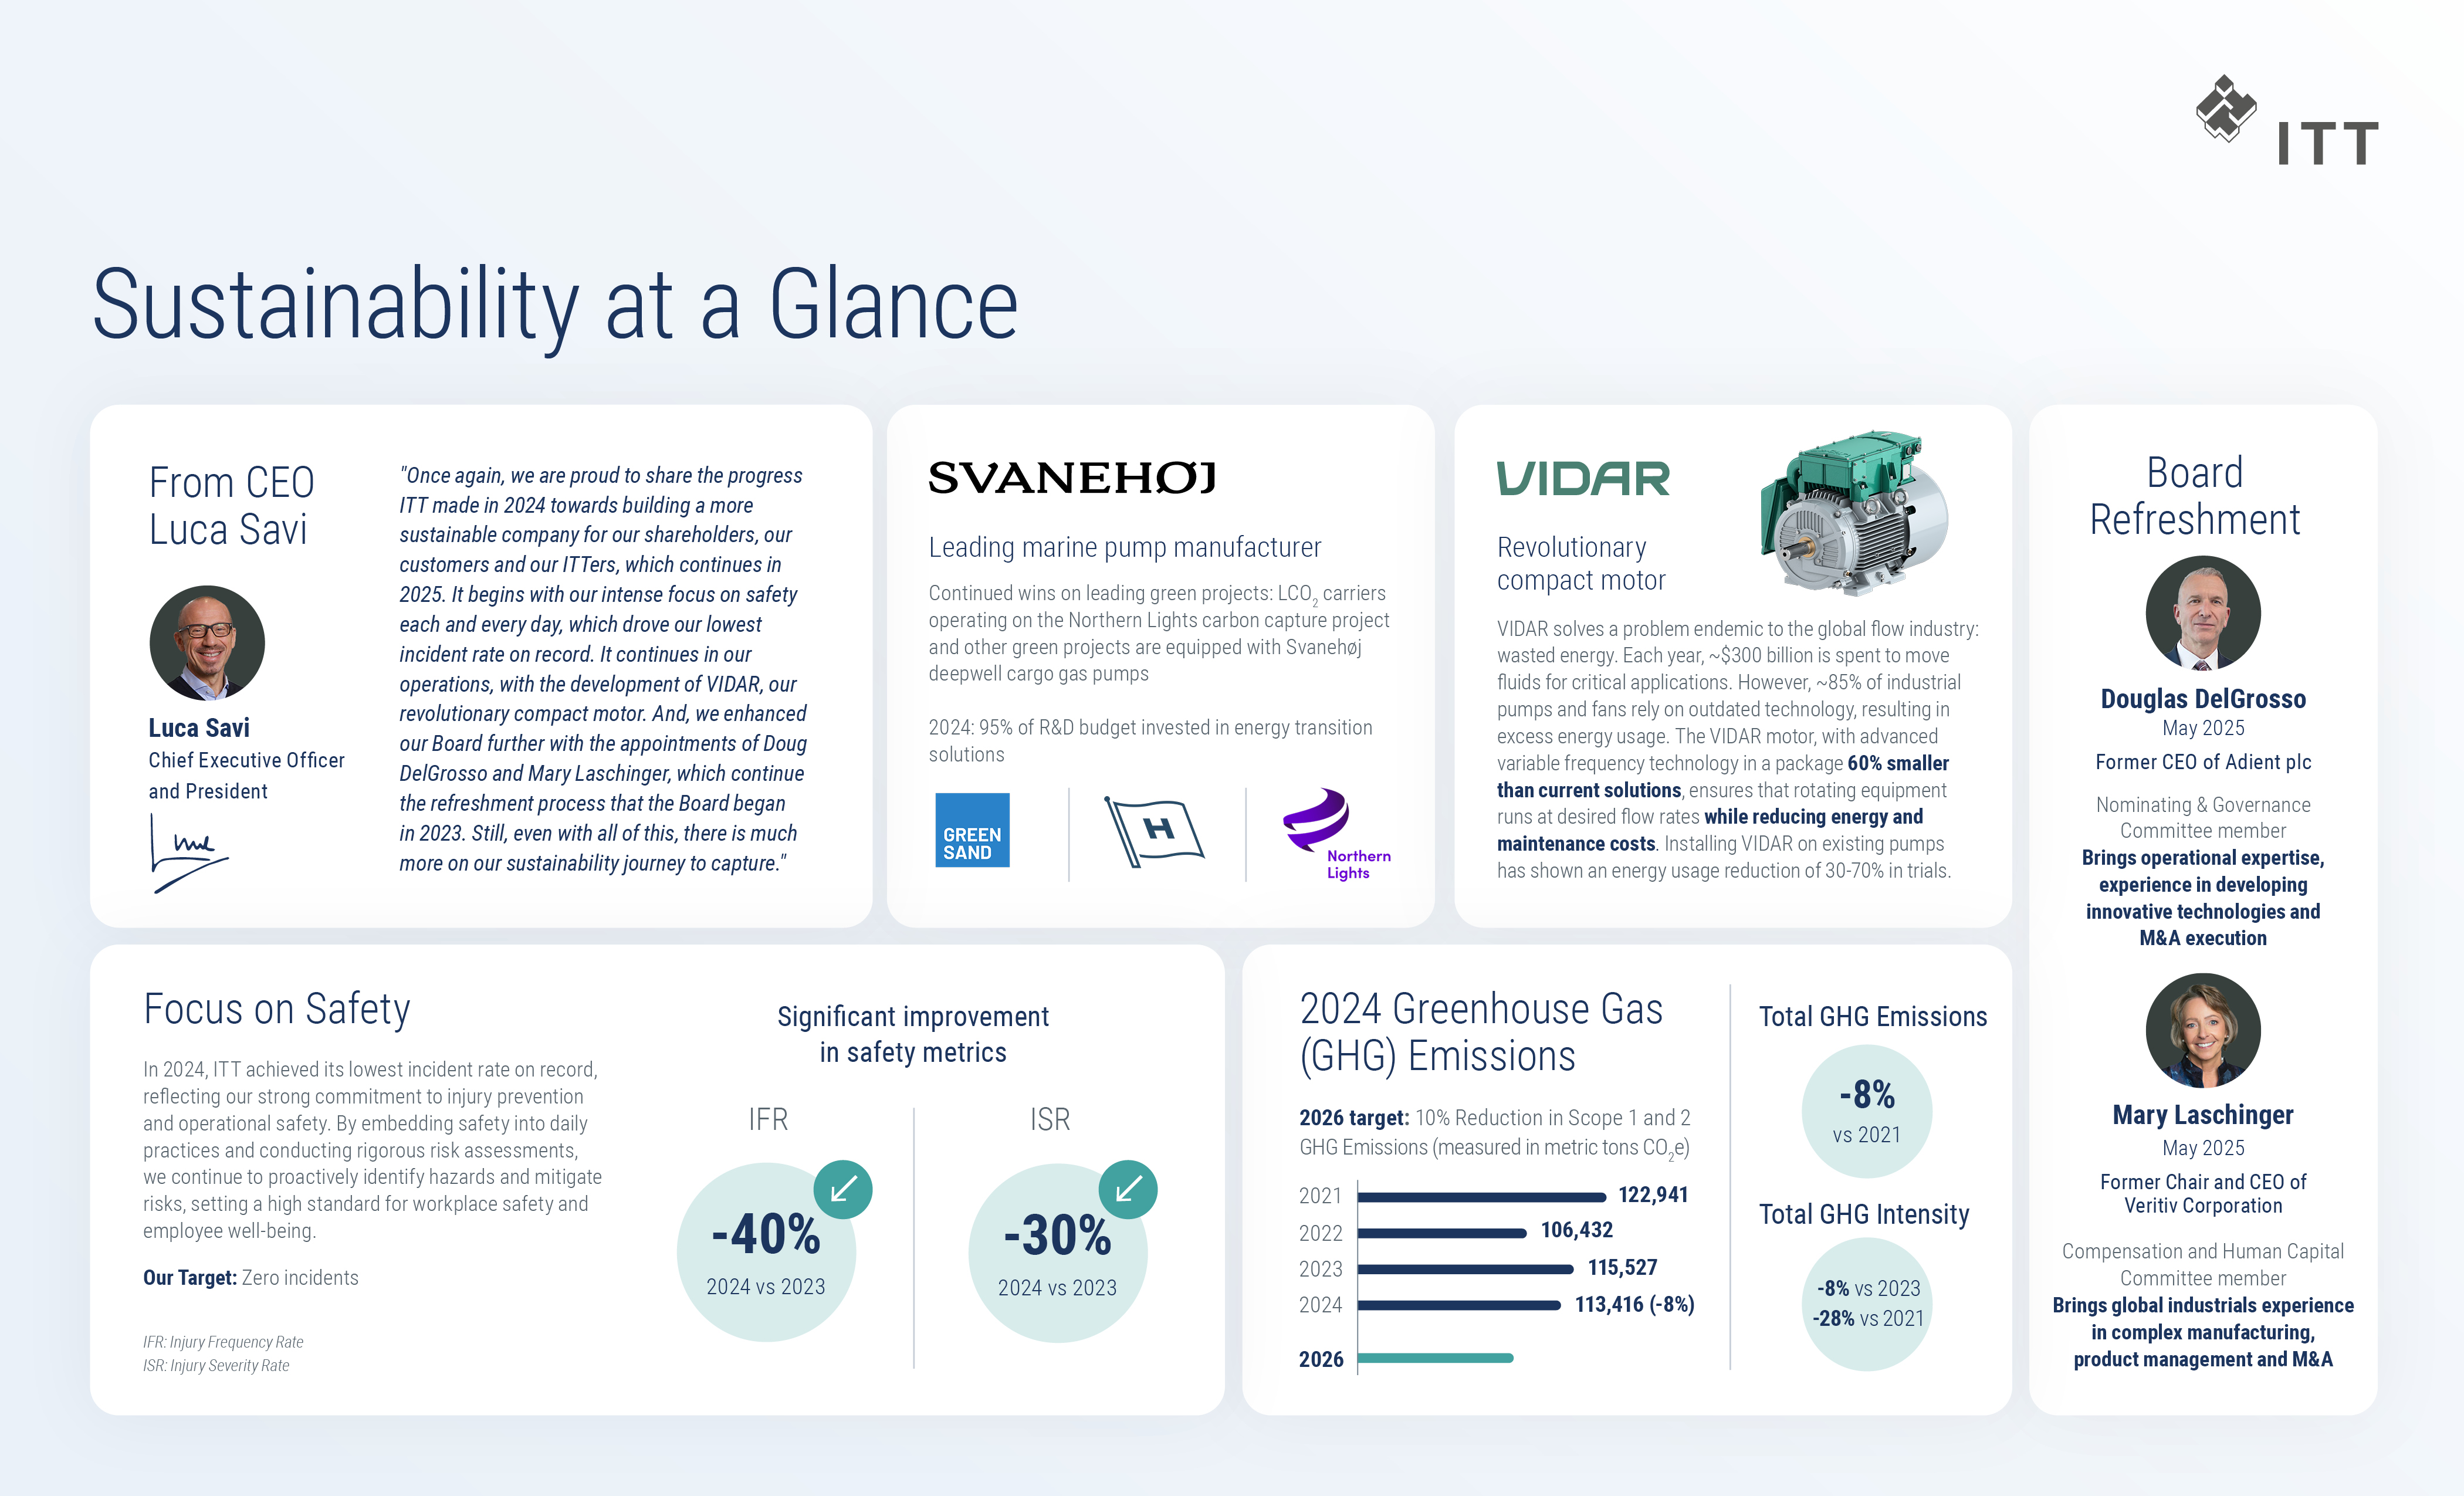
SUSTAINABILITY
- Development of innovative products that help customers achieve their sustainability goals
- Investment in technologies to reduce our CO2 emissions and waste
- Development of a credible path to carbon neutrality through our Reduce–Avoid–Offset framework
We partner with our customers to solve challenging problems and deliver best-in-class solutions. ITT's products enable them to operate more efficiently, reduce their total cost of ownership and produce sustainable, environmentally impactful technologies.
At the same time, it is a business imperative for us to ensure our operations are efficient, sustainable and environmentally conscious. In 2021, we developed a Reduce–Avoid–Offset framework through which we are pursuing our goal of reducing greenhouse gas emissions. The framework will drive the creation of our path to carbon neutrality.
We recognize that sustainable performance and growth are made possible only through the efforts of our dynamic, diverse team of nearly 10,000 ITTers. Given this, one of our most important commitments as a company is to create an engaging, inspiring place to work and drive actions that enable every individual's full potential and performance.
That's why at ITT, we put ITTer's safety and well-being first in everything we do, investing in meaningful career development and prioritizing efforts to build a diverse, equitable and inclusive workplace where innovation thrives. Everyone is encouraged to achieve their aspirations.
ITT has been an early adopter of many of the most significant governance advances over the last two decades, including majority voting for uncontested director elections, proxy access bylaws, an independent Board Chair and shareholder rights to call a special meeting.
ITT's Board of Directors believes in strong corporate governance and is committed to sound principles and practices. Meanwhile, our ethics and compliance and enterprise risk management programs, and ongoing shareholder engagement ensure we understand key risks and market trends as an organization and deploy resources appropriately to meet our current and future needs.